Basic Circle Graphs on the ISEE
All Levels
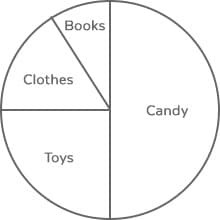
ISEE Question: Johnny’s parents will give him a $40 allowance, but only if they approve the way he is going to spend it. Johnny proposes the following budget graph. Approximately how much would he like to spend on clothes and books combined?
A) $5
B) $10
C) $12
D) $15

Helpful Tip: Words like “approximately” and “about” in an ISEE question mean that you don’t have to calculate precisely but only estimate the answer.
Solution: A circle graph is useful in representing the entire amount of something, or 100%. In this case, the circle represents the $40 allowance and each sector, or “slice of the pie,” represents a part of it.
STEP 1: Analyze the regions:
- The Candy slice is exactly half of the pie, so Johnny plans to spend $20 on candy.
- The Toys slice, on the other hand, makes a right angle with the center of the circle, so it takes about a fourth of the pie. ¼ of $40 is exactly $10.
- The Clothes and Books combined also account for $10 combined, so the correct answer is B). Done!


