Challenging Circle Graphs on the ISEE
Middle and Upper Level
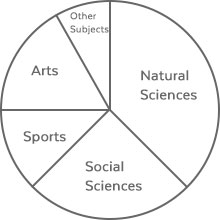
ISEE Question: A Liberal Arts college has decided to allocate its $20 million endowment according to the circle graph on the right. Which two disciplines combined account for LESS than $5 million?
A) Natural and Social Sciences
B) Social Sciences and Sports
C) Arts and Other Subjects
D) Sports and Other Subjects

Solution: At a first glance, this question may seem impossible because there are no numbers on the circle graph. But on the ISEE, you’re sometimes asked to logically get “the big picture” without many calculations.
STEP 1: We are looking for $5 million out of a total budget of $20 million, so exactly one fourth of the budget.
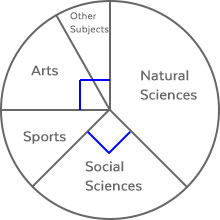
Helpful Tip: On circle graphs, it helps to look for right angles. A right angle is 90°, and a whole circle is 360°, so each right angle is exactly ¼, or 25%, of the circle.
STEP 2: The Social Sciences sector by itself looks like a right angle. There’s another right angle formed by Arts and Other Subjects combined.
The Natural Sciences region takes more than a fourth of the circle (it looks like about a third).

STEP 3: Using the process of elimination, we can cross out answers A) and B) because they will be much more than one fourth, or $5 million. As we decided that Arts and Other Subjects together form a right angle, we can cross them out as well (a fourth of the circle is exactly $5 million). The only answer left is D)!
Helpful Tip: Try to do as few calculations as possible. This question, for instance, asks for an amount LESS than something, and we know that only one answer can be correct, so the correct answer must be the smallest two regions combined!


